|
High probability of detection After a signal is found and stored in the database the software decides whether it is a danger signal or not. To do this a series of tests is performed:
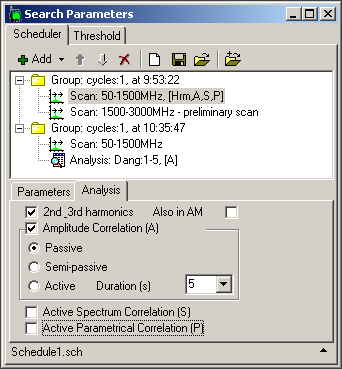
Scheduler The operator can create any number of Task Groups which can be executed a certain number of times or with programable durations. The task groups can be performed in a direct order or be initiated by the watchdog timer and performed individually.
A Task Group may consist of any number of Scan Tasks and Analyze Tasks:
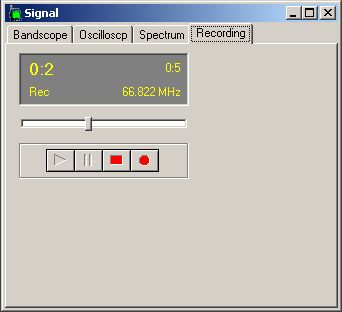
Signal classification according to the Danger Level Each found signal is assigned its own danger level from 0 to 6. Non-dangerous signals from broadcasting, TV or communications will usually have level 0. Signals with level 1 are treated as suspicious and are subject to additional checks. Signals with higher danger levels are considered dangerous. The assignment of the danger level is based on the results of a given tests. Each test has its own weight. For example, the AAC has a weight 2, APC - 1. Automatic sound recording and printout A sound recording can be made when a detected signal has a high danger level. It can also be queued for printout. Sound files are in WAV format and are stored in the database. Each signal in the database can have its own sound file. The quality and the recording time is chosen by the operator in the parameters window.
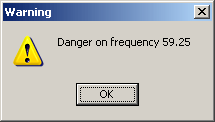
Notification the operator The operator can be warned during a search by a specially assigned sound and message window that a dangerous signal has been found. This option can be selected in the parameters window.
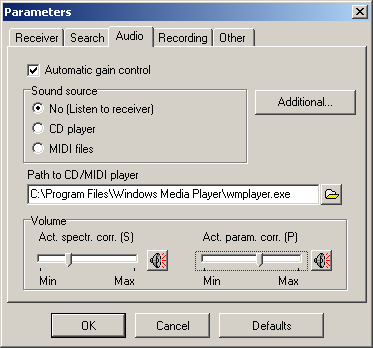
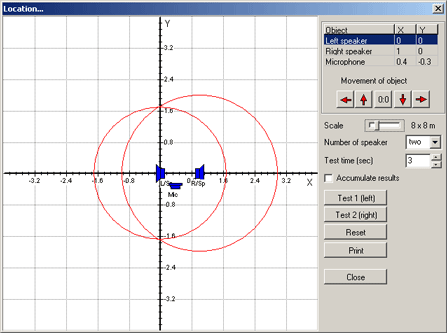
Silent search When a covert operation is necessary the operator can engage passive tests - PAC or PCP. In such cases the computer produces no special sounds and any unwanted person will not be aware of the proceeding sweep. Automatic sound flooding of a room A sound must be present in a room for the activation of a voice-activated bugging device, for masking the sweeping procedure and for the success of passive tests. Therefore the software controls the computer's CD-player and can play music CDs or MIDI files to generate this necessary sound. Location of a bugging device The spakers of the computer are used to produce impulses which are then picked up by a bugging device's microphone at a delayed interval to the program's own microphone. The software then compares the location of its own microphone/speakers to the bugging device and can decide the approximate location of it.
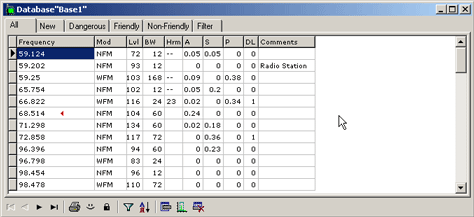
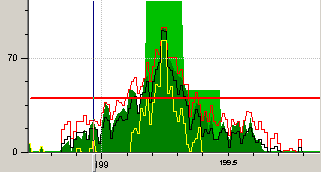
The database All detected signals, not depending on their danger level, are stored into the database. The database has four sections "All", "New", "Dangerous", "Friendly". It consists of the following information about each signal: frequency, modulation, width, level, harmonic presence, amplitude correlation, spectrum correlation, danger level, date and time of detection, counter and attributes. The spectrums of the signals are also stored in the database. Friendly signal database Friendly signals improve the speed of a search, as the software does not test permanently existing signals of broadcasting, TV and communications. A special mode exists for filling in the database with all friendly signals present in an area. Multisection threshold Any number of sections can be created in the range of the receiver. Each section can have its own level of threshold and attenuator state. Adjustment of the level can be done directly in the bandscope window where background noises can be seen and omitted. Support of the scaleable bandscopes The following bandscopes can be displayed simultaneously: current bandscope, the spectrums of signals from the database, minimums, maximums and average bandscope. The operator can set an arbitrary bandwidth of the bandscope from tens of kiloherz to the whole range covered by the receiver. There are 2 bandscope windows: Main Bandscope Window - usually displaying many signals in a wide range; Auxiliary Bandscope Window - displaying each separate signal. Showing the mins/maxs allows the user to discover and analyze non-constant signals.
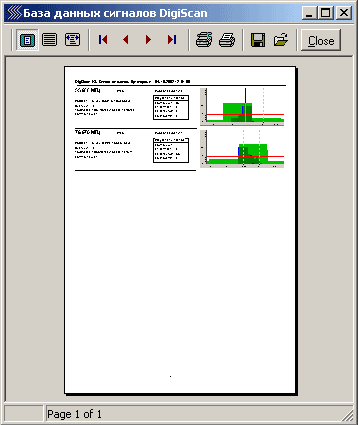
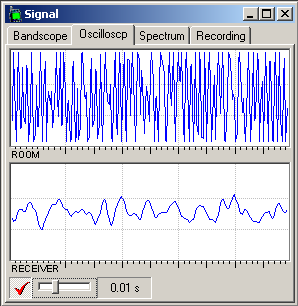
Printout of the signal's spectrum and its chartacteristics Each signal can be printed separetely, or together with other signals. Both graphical chart and a signal's characteristics are printed. When a suspicious signal is detected, the operator can print out a report and then use it at a later time to trace its change. The two accoustics of the room and of the signal from the receiver's audio output are displayed in the oscilloscope whereas their spectral FFT view is shown in the spectroscope. The oscilloscope's length can be set from 1 ms to 10 s, spectroscope's bandwidth can be 2, 3, 6, 10 kHz. Testing of wires With the use of the Very Low Frequency (VLF) Convertor DS-Line (sold separately) it is possible to test telephone lines and AC mains wires for their transmission of accoustics. Adjustable parameters
|

